This post will look at some of the ways in which you can monitor a NSX implementation, along with some of the features NSX provides to help you. As with my previous post on administering NSX logging, there are a number of different places where various NSX components can be monitored, such as the vSphere Web Client, CLI, Syslog, API and more. I’ll start by looking at how you can monitor some of the infrastructure/management components.
Monitoring NSX Infrastructure
A good place to start is to check the health of the NSX Manager. One of the ways to do so is to log into the management interface. On the summary page, you can get an overview of the system, along with the status of its services:
The status of the NSX controllers can be monitored by logging into the vSphere Web Client, and heading to ‘Networking & Security’, and then the ‘Installation’ screen. In the bottom half of the screen the status of the NSX controllers is displayed. A ‘normal’ status should be displayed when the controller is healthy.
Monitoring NSX Edge Routers
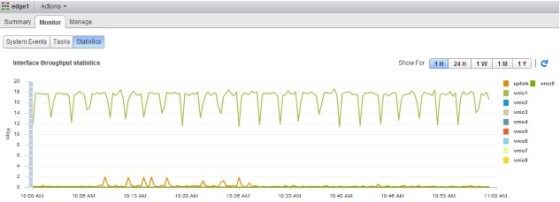
Charts showing interface throughput statistics are available to give you a view of the network activity on NSX edge services routers:
Activity Monitoring
As stated here, activity monitoring gives you visibility into your virtual networks to ensure that security policies are being enforced correctly. It provides you with a way to monitor traffic inside your virtual network. Activity monitoring allows you to check whether your high level security policies are having the desired effect at the virtual machine/application/ IP level. You can generate reports about connections between various objects defined in vCenter.
Activity monitoring needs to be enabled at the VM level. To do so, browse to the virtual machine for which you want to enable data collection for, using the vSphere Web Client. On the summary tab there is a section for NSX Activity Monitoring:
Clicking ‘Edit’ will give the option to enable activity monitoring for the VM:
Once done, data will be collected and reports can be run against the VM:
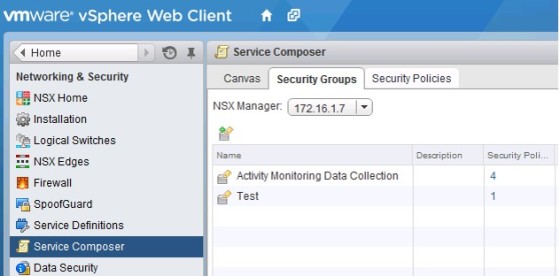
To enable data collection for a group of VMs, rather than going to each one individually, you can use Service Composer. Under ‘Security Groups’ there is a built in group called ‘Activity Monitoring Data Collection’:
You can edit the group, to include the virtual machines for which activity monitoring should be enabled. Once data is being collected for virtual machines, you will be able to run activity reports.
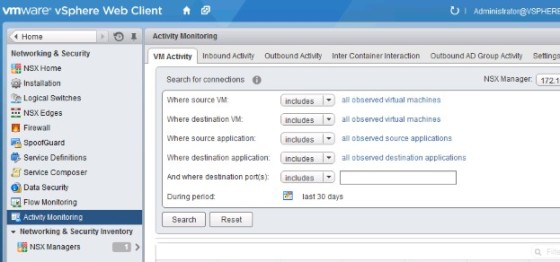
To run activity reports, go to ‘Activity Monitoring’, which can be found in the vSphere Web Client under ‘Networking & Security’:
Example scenarios of how Activity Monitoring can be used can be found here.
Flow Monitoring
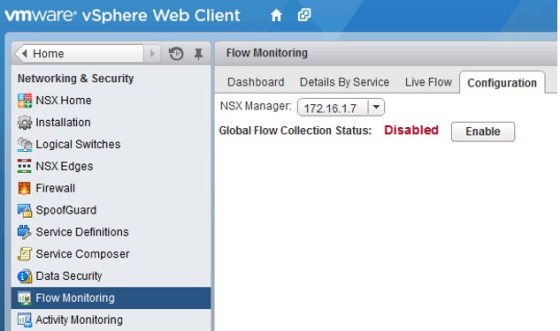
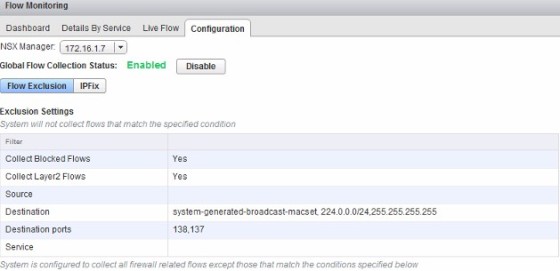
Flow monitoring is a tool in NSX that provides you with a way to view reports, or in real time, the network flows in the NSX virtual network. Before it can be used, flow monitoring needs to be enabled. To do so, head to the Flow Monitoring page in the vSphere Web Client (as always with NSX related settings, it’s found under Networking & Security):
Once there, on the configuration tab, click the ‘Enable’ button to enable flow monitoring:
After a while, the dashboard tab will populate with flow data.
You can monitor live network flows on the ‘Live Flow’ tab. To do so, you first need to enable live flow monitoring on a VM’s vNIC, by clicking the browse button:
Once a vNIC has been selected, click the ‘Start’ button to being live flow monitoring:
Documentation on flow monitoring can be found here.


