Excessive memory consumption can cause performance issues for hosts and virtual machines. When a host is under pressure in terms of available physical memory, it may have to begin swapping memory to disk, which will negatively affect virtual machine performance.
I’ve previously written an article about monitoring memory performance using esxtop, but will cover the main metrics to be aware of when troubleshooting memory performance issues here. The memory page in esxtop is a good place to start:
 6:03:11pm up  1:18, 329 worlds, 4 VMs, 5 vCPUs; MEM overcommit avg: 0.50, 0.50, 0.50
PMEM  /MB:  4095   total:   883     vmk,  1258 other,   1953 free
VMKMEM/MB:  4077 managed:   244 minfree,  3062 rsvd,   1015 ursvd,  high state
PSHARE/MB:  2855  shared,    97  common:  2758 saving
SWAP  /MB:   257    curr,   241 rclmtgt:                 0.00 r/s,   0.00 w/s
ZIP   /MB:    26  zipped,    15   saved
MEMCTL/MB:  1330    curr,  1330  target,  3327 max
View VM only
     GID NAME               MEMSZ    GRANT    SZTGT     TCHD   TCHD_W    SWCUR    SWTGT   S
    3991 XP2              3072.00  3048.00   879.75    92.16    61.44     0.75     0.00
    3988 XP1              2048.00   503.92   175.12    43.03    21.51     5.46     3.88
    4004 TestVM08          700.00    61.86    90.16     0.00     0.00     0.00     0.00
    4007 TestVM07          128.00    56.99    80.79     2.56     0.00     0.00     0.00
There is a lot of data here, so I’ll break down what some of the metrics are.
- PMEM/MB – This is the amount of physical memory on the host. In this case it is 4095 MB. VMK refers to the memory being used by the VMKernel, Other is the amount of memory being used by everything other than the VMkernel and Free, is the amount of free memory.
- VMKMEM/MB – This is the amount of physical memory currently managed by the VMkernel. 4077 MB. ‘Min Free’ is the amount of memory that the VMkernel aims to keep free (this can be tweaked with the mem.memfreepct advanced setting). ‘rsvd’ is the amount of memory reserved by resource pools. ‘ursvd’ is the amount of memory that is currently unreserved.
- PSHARE – This is the savings made by Transparent Page Sharing – The memory savings here are 2758MB from the 4 virtual machines that are running.
- State – The host is currently in the ‘high’ state. This is an indication of whether the host is currently reclaiming memory. More on this later.
- SWAP/MB – This is the total memory swapped out for all virtual machines on the host. ‘curr’ shows the current swap usage, r/s and w/s show the rate that ESXi is swapping memory to disk
- ZIP/MB – These are the memory compression statistics
- MEMCTL/MB – These are the memory balloon statistics.
Below these are the virtual machine specific counters, which include:
- MEMSZ – the amount of memory allocated to the virtual machine
- MCTLSZ – When > 0 the host is forving VMs to inflate balloon driver to reclaim memory.
- SWR/s – If > 0 then the host is swapping memory in from disk.
- SWW/s – If > 0 then the host is swapping memory out to disk.
- SWCUR – The amount of swap space in use by the VM. A value greater than zero indicates that the host has previously swapped memory.
- SWTGT – The amount of swap space the host anticipates would be in use by a VM.
- SWPWT – Percentage of time a virtual machine is waiting for memory to be swapped back in from disk. A value exceeding five should be acted upon.
- MCTL – Displays whether or not the balloon driver is installed on the virtual machine.
- ZIP – If > 0 the host is actively compressing memory.
- UNZIP – if > 0 the host has accessed compressed memory.
Host Swapping and Memory Reclaimation
When a host is suffering from a lack of memory resources it will attempt to reclaim memory that it has already handed out to virtual machines. There are four host ‘free memory’ states, which indicate whether a host is attempting to reclaim memory. These are High, Soft, Hard and Low.
The state the host is currently in can be see clearly on the memory screen in ESXTOP:
11:40:06pm up 30 min, 326 worlds, 2 VMs, 3 vCPUs; MEM overcommit avg: 0.00, 0.00, 0.00
PMEM  /MB:  4095   total:   878     vmk,   416 other,   2800 free
VMKMEM/MB:  4077 managed:   244 minfree,  3192 rsvd,    885 ursvd,  high state
PSHARE/MB:    39  shared,    21  common:    18 saving
SWAP  /MB:     0    curr,     0 rclmtgt:                 0.00 r/s,   0.00 w/s
ZIP   /MB:     0  zipped,     0   saved
MEMCTL/MB:     0    curr,     0  target,    36 max
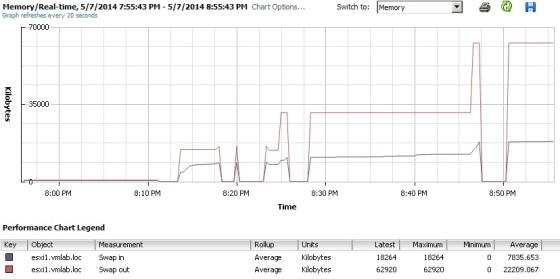
The example output above shows a host in the ‘High’ state, which means it is not currently under memory contention. If the host is in the ‘Soft’ state then ballooning is used to reclaim memory. In ‘Hard’, Swapping and compression is used to reclaim, and when the host is in the ‘Low’ state, ballooning, swapping and compression are all used to attempt to reclaim memory. Swapping will have a negative affect on the performance of the host and virtual machines – you can monitor swapping by using the Swap In and Swap Out metrics in vCenter. On a healthy host, these values should always be low:
If the host has been or is under memory contention you will see something more along the lines of:
It is likely that the state will have changed in esxtop at this time:
 5:25:56am up  6:16, 344 worlds, 4 VMs, 5 vCPUs; MEM overcommit avg: 0.50, 0.50, 0.48
PMEM  /MB:  4095   total:   885     vmk,  2948 other,    261 free
VMKMEM/MB:  4077 managed:   244 minfree,  3020 rsvd,   1057 ursvd,  soft state
PSHARE/MB:  1444  shared,   154  common:  1290 saving
SWAP  /MB:   161    curr,   160 rclmtgt:                 0.02 r/s,   0.00 w/s
ZIP   /MB:    15  zipped,     9   saved
MEMCTL/MB:  1167    curr,  1310  target,  3327 max
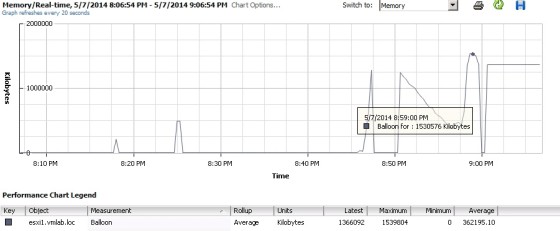
As shown above, the host is in the ‘soft’ state, meaning that it is actively ballooning in order to reclaim memory. We can confirm that ballooning has occurred by adding the Balloon metric to the chart:
The state is good indication of what shape the hosts memory is in. If the host is actively swapping there will be performance degradation for the virtual machine(s). To see whether swapping is affecting a given virtual machine, you can use the %SWPWT metric, which is found on the CPU page in esxtop:
ID      GID NAME                      NWLD   %USED    %RUN    %SYS   %WAIT %VMWAIT    %RDY   %IDLE  %OVRLP   %CSTP  %MLMTD  %SWPWT
    3991     3991 XP2                 7   37.70   38.04    0.62  660.30   11.35    1.80   50.09    0.98    0.00    0.00   12.12
    3988     3988 XP1                 8    3.77    3.78    0.06  793.56    4.17    2.81  189.73    0.08    0.00    0.00    2.90
    4004     4004 TestVM08            6    0.22    0.21    0.01  599.57    0.00    0.34  100.10    0.00    0.00    0.00    0.00
    4007     4007 TestVM07            6    0.20    0.20    0.00  599.39    0.00    0.53  100.04    0.00    0.00    0.00    0.00
%SWPWT shows the percentage of time that a virtual machine is waiting for it’s pages to be swapped. In the example above we can see that the XP2 (and to a lesser extent, XP1) virtual machine is waiting for it’s pages to be swapped, which will negatively affect the VMs performance. Any value above zero indicates a problem. If the value is above 5 then the cause should be investigated immediately.
With this example the cause was due to memory over commitment, with both of the XP virtual machines using all their memory allocation at the same time. It’s also worth checking whether the balloon drivers are present in the virtual machines that are swapping, as without the driver the host may be forced to swap rather than use ballooning (which has a lower impact). The balloon drivers get installed onto the guest VM when you install VMtools. You can check that the balloon drivers are present and enabled by looking at the ‘MCTL?’ column:
 GID NAME                 MEMSZ    GRANT    SZTGT     TCHD     TCHD_W  MCTL?   MCTLSZ  MCTLTGT  MCTLMAX
    3991 XP2              3072.00  3048.14   576.71   153.60   122.88     Y     0.00     0.00  1996.46
    3988 XP1              2048.00   505.10   188.94    35.86    28.68     Y  1330.86  1330.86  1330.86
    4004 TestVM08          700.00    61.86    90.41     0.00     0.00     N     0.00     0.00     0.00
    4007 TestVM07          128.00    56.99    81.25     2.56     0.00     N     0.00     0.00     0.00
A ‘Y’ indicates that the balloon drivers are present in the virtual machine and enabled.


