I’ve been working a lot with the web client recently, and came across this, so thought I’d do a quick post.
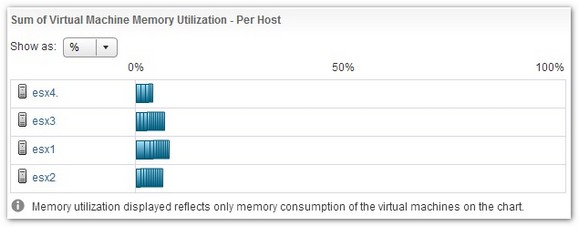
When you are looking at the DRS resource utilization charts in the web client, and in the VI Client, you will notice that they show what looks like a completely different impression of how busy the host is.
In the VI Client you may see something like this:
Whilst in the web client, looking at the same cluster, we see the following:
The reason for the different readings is due to the web client using Active Memory as the metric it reports on, whereas the VI Client or ‘fat’ client uses Consumed Memory as it’s metric. The reason for this is that, Active Memory is the metric DRS actually uses in its calculations so this gives a more accurate impression of the cluster from a DRS point of view.

